Abstract: Many retail traders lose their capital because they trade based on gut feelings or short-term charts. In this technical guide, we explain the mathematics of backtesting, detail why it is a mandatory step before going live, and cover key metrics like Profit Factor and Drawdown. We also look at how algorithmic indicators like GainzAlgo automate this validation process, helping traders remove human emotion and verify their historical edge.

1. Introduction: The Illusion of a Perfect Strategy
In the world of retail trading, optimism is abundant but discipline is rare. Many newcomers enter the market with a “feeling” that an asset is going to rise, or they try to copy a pattern they saw in a short video clip online. They believe that trading is an art form driven by intuition or that a specific trading indicator is a magic wand that guarantees instantaneous profits. However, without historical validation, entering a trade is closer to gambling than investing.
Every successful systematic trader understands that the market operates in shifting regimes-ranging from high-volatility ranges to smooth, low-volatility trends. A strategy that generates double-digit returns during a bull market might completely wipe out an account when the market enters a consolidation phase. Backtesting is the only process that allows you to discover this vulnerability before risking your hard-earned capital.
Transitioning from discretionary trading (trading based on gut feeling) to systematic trading (trading based on a set of rules) provides immense psychological relief. When you trade based on random observations, every loss feels like a personal failure, causing stress, doubt, and impulsive behavior. By validating your rules over historical data, you change your perspective: you no longer care about the outcome of any single trade. Instead, you focus on executing the system consistently, knowing that the system’s mathematical edge will play out over a large sample size of trades.
2. What is Backtesting and Why is it Unmissable?
Backtesting is the process of reconstructing historical market conditions using past price, volume, and volatility data to determine how a specific set of trading rules would have performed in the past.
By feeding your strategy rules-such as entry triggers, stop-loss levels, and take-profit targets-into historical charts, you create a simulated track record. This process is essential for several reasons:
- Statistical Sample Size: A strategy that wins 5 times in a row on a live demo account feels successful. However, statistically, 5 trades are meaningless. Backtesting allows you to run your rules across hundreds or thousands of historical trades, giving you a valid sample size to calculate your true mathematical expectancy.
- Psychological Confidence: The biggest enemy of a manual trader is emotion. When you hit a losing streak of three or four trades in real-time, the natural human reaction is to panic, abandon the rules, or trade twice as large to win back the losses (revenge trading). If you have backtested your strategy over a five-year period, you will know that a four-trade losing streak is a normal deviation, helping you stay disciplined.
- Capital Preservation: Discovering that a strategy has a 60% maximum drawdown in historical testing costs you nothing. Discovering that same fact in live markets can result in a margin call and account liquidation.
Historical Data Granularity and Resolution Layers
When performing a technical backtest, the quality of the historical data directly influences the validity of the results. There are two primary types of data resolution:
- OHLC (Open, High, Low, Close) Candles: The backtest engine evaluates data at the close of specific time intervals (e.g., 1-hour or 4-hour bars). While fast, this method ignores intraday price movements, which can lead to false fills where the engine assumes a target was hit before a stop-loss, when the reverse actually occurred.
- Tick-by-Tick Data: The engine processes every single quote change (ticks), including variable bid and ask prices. This is the gold standard for backtesting since it accurately reconstructs raw market liquidity, ensuring that execution calculations mirror live market reality.
3. The Pitfalls of Visual Backtesting (Hindsight Bias)
Many traders attempt to backtest by opening a static chart, scrolling backward in time, and manually looking for instances where their indicators crossed or candle patterns appeared. This is known as visual backtesting, and it is highly prone to hindsight bias.
When you look at historical data in its entirety, your brain already knows the outcome. You see a massive upward spike, and your eyes naturally search for the nearest support level or moving average crossing that occurred before the spike, concluding: “I would have bought here.”
However, in live trading, you do not see the right side of the chart. You do not know if that support level will hold or if it will collapse. Visual backtesting ignores the dozens of false signals, consolidation choppy zones, and execution slips that occur in real-time. To build an objective model, you must use strict, rule-based execution pathways or automated testing tools that simulate candle-by-candle progression.
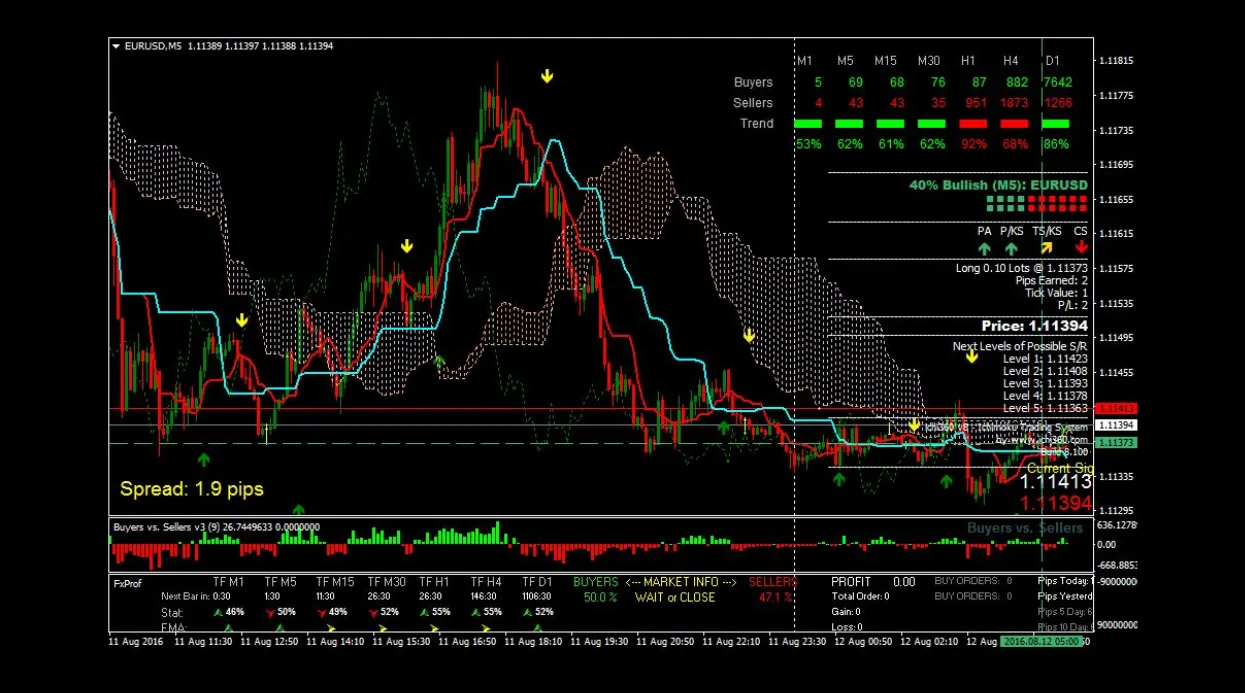 Systematic Signal Logs
4. Key Metrics Every Trader Must Track
When compiling your backtesting database, you should look beyond the simple “win rate.” A strategy with a 90% win rate can still lose money if the average loss is ten times larger than the average win. To evaluate performance accurately, you must track the following metrics:
1. Expectancy
Trading expectancy is the average amount you expect to win or lose per trade, represented as a dollar value or risk multiple (R).
Expectancy = (Win Rate * Average Win) - (Loss Rate * Average Loss)
If your expectancy is positive (e.g., +0.3R), your strategy is mathematically viable over a large sample size of trades. This means that for every dollar you risk, you expect to return 30 cents in profit over the long run.
2. Profit Factor
The Profit Factor is the ratio of gross profits to gross losses over the entire testing period.
Profit Factor = Gross Profits / Gross Losses
- A Profit Factor of 1.0 means you broke even.
- A Profit Factor between 1.5 and 2.0 is generally considered healthy.
- Anything above 2.5 is exceptional, though you must verify that it is not the result of over-optimization (curve fitting).
3. Maximum Drawdown (Max DD) and Recovery Period
Drawdown measures the peak-to-trough decline in your trading account equity, represented as a percentage of your starting balance.
- Max DD is the largest peak-to-trough drop your account experienced during the backtest. If your strategy has a Max DD of 45%, you must ask yourself: “Do I have the emotional resilience to watch my $10,000 account fall to $5,500 without panicking?”
- Recovery Period: The time it takes for the equity curve to recover from a trough back to its previous peak (high-water mark). A system with low drawdown but a 2-year recovery period can be highly testing to trade manually.
4. Sharpe and Sortino Ratios (Risk-Adjusted Returns)
Professional quantitative analysis requires measuring return relative to volatility:
-
Sharpe Ratio: Measures excess return per unit of total risk (standard deviation of returns):
Sharpe Ratio = (Portfolio Return - Risk-Free Rate) / Standard Deviation of Portfolio Returns
-
Sortino Ratio: Differs from Sharpe by only penalizing negative volatility (downside risk), since positive volatility represents profit spikes:
Sortino Ratio = (Portfolio Return - Risk-Free Rate) / Downside Standard Deviation
5. Pros & Cons of Manual vs. Algorithmic Backtesting
Choosing the method of your testing protocol determines the accuracy and speed of your development cycle. Let’s compare manual spreadsheet tracking against automated, algorithmic systems:
Manual Backtesting
- Pros: Develops a deep, intuitive feel for chart structures and market behavior. Requires no programming knowledge.
- Cons: Extremely slow (taking days to log a few hundred trades). Highly vulnerable to subjective interpretation and hindsight bias.
Algorithmic Backtesting
- Pros: Insulated from human emotion. Compiles thousands of trades in seconds across multiple markets. Objective, rule-based output.
- Cons: Requires coding skills (or specialized paid software) to write logic. Vulnerable to curve-fitting and programming errors.
Manual Backtesting Challenges and Benefits
Manual backtesting is a labor-intensive process. A trader must manually scroll through historical candles, identify entries, calculate price targets, and enter every single variable into a spreadsheet. The benefit is qualitative; it trains the trader’s eye to recognize market structures, price action clues, and subtle details that code cannot easily capture. However, because it is slow, traders often suffer from fatigue, leading to data entry mistakes, skipped trades, and selective logging that artificially inflates the win rate.
Algorithmic Backtesting Capabilities
Algorithmic testing solves this speed barrier by translating trading rules into code (like Pine Script on TradingView or Python pandas/backtrader). Once coded, the computer runs the strategy through millions of historical data bars in seconds. This allows you to perform multi-variable optimization, test across different slippage and commission rates, and analyze portfolio correlations. The limitation is technical; if your rules are not 100% objective, they cannot be programmed, and coding errors (bugs in the logic) can yield highly deceptive, incorrect results.
6. How Overfitting (Curve Fitting) Can Ruin Your Account
One of the most dangerous traps in systematic trading is overfitting (also known as curve fitting). Overfitting occurs when a trader adds too many rules, parameters, and filters to their strategy to make it fit a specific historical data set perfectly.
For example, a trader might adjust their indicator settings so that they filter out every single historical loss in 2025. The backtest returns a flawless equity curve with a 95% win rate and a Profit Factor of 4.5.
However, because the strategy is custom-tailored to the historical noise of 2025, it lacks robustness. When deployed in the live market, it is exposed to brand-new, unseen price distributions. Because the rules are too rigid, the strategy fails immediately, leading to severe losses. To prevent overfitting, always reserve a portion of your historical data (out-of-sample data) to test the strategy after optimization.
Detecting and Preventing Overfitting
To identify if your strategy is overfitted, perform a parameter sensitivity analysis. If you are using a 20-period moving average that yields excellent results, but changing it to a 19 or 21-period moving average causes your strategy to become unprofitable, your system is overfitted. A robust strategy should show stable, consistent performance across a range of parameters.
Quantitative funds prevent overfitting by splitting their data. They use 70% of historical data (the “In-Sample” set) to build and optimize the strategy. Once they find the best settings, they test it on the remaining 30% of data (the “Out-of-Sample” set) which the optimization engine has never seen. If the strategy performs similarly on both sets, it is considered robust.
Another method is Walk-Forward Analysis (WFA). WFA tests a strategy by optimizing parameters over a rolling historical time window (e.g., 1 year), and then running those optimized settings forward on a consecutive, short out-of-sample window (e.g., 3 months). This process is repeated across multiple windows, simulating how the system would have performed under dynamic optimization over time.
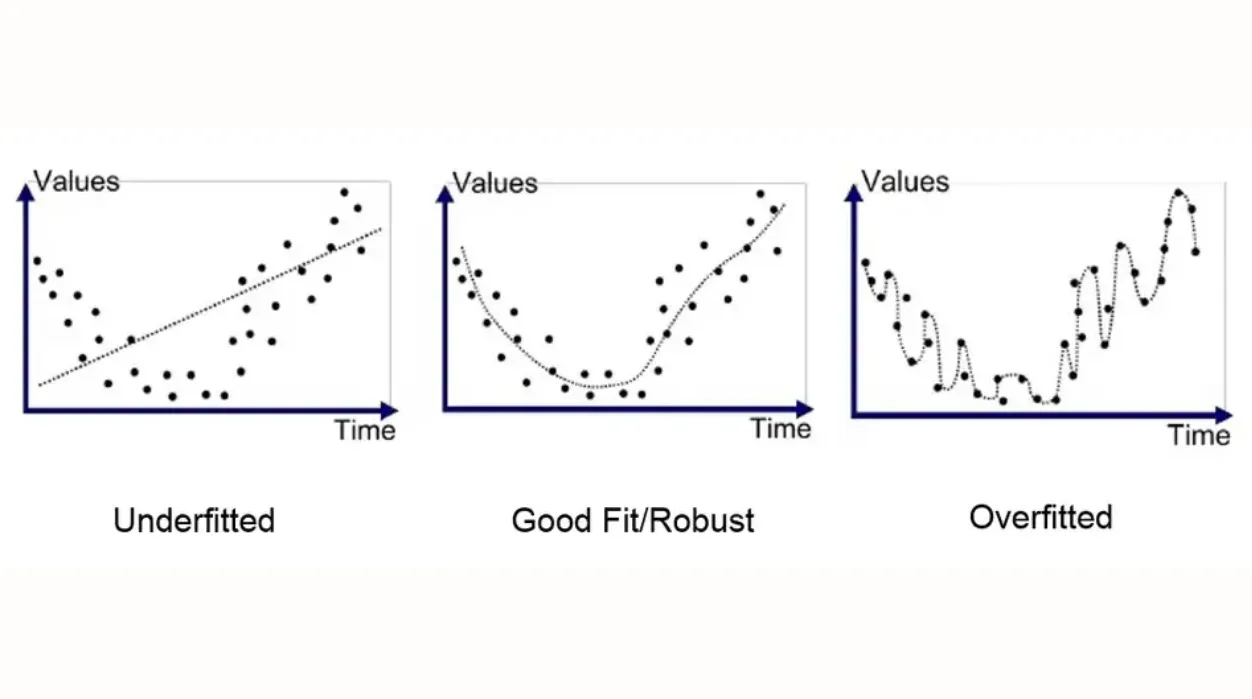 Overfitting in Trading
7. Automated Verification: The Power of Algorithmic Indicators
For traders who do not have the programming skills to write custom code in MQL or Python, the modern alternative is utilizing pre-built, institutional-grade algorithmic indicators.
These tools run complex calculations directly on your charting terminal (like TradingView). They analyze historical price action, moving averages, and volatility ratios to generate immediate, objective buy and sell signals. By using a standardized algorithm, you remove the subjective “guesswork” of visual analysis, allowing you to run clean backtests across multiple assets and timeframes.
Eliminating Human Fatigue and Subjectivity
The primary advantage of algorithmic indicators is consistency. Human traders are subject to cognitive fatigue. If you analyze charts manually for several hours, you are highly likely to miss setups, miscalculate risk, or let your bias color your decisions.
An algorithm never gets tired, stressed, or greedy. It evaluates every new candlestick with the exact same mathematical logic, ensuring that your strategy is executed with 100% precision. This uniformity is what makes the backtesting data reliable; you are testing a repeatable process rather than a set of erratic decisions.
8. Forward Testing: The Bridge to Live Markets
While a backtest proves that a strategy had an edge in the past, it does not guarantee execution success in the future. Forward testing (also known as paper trading) is the essential step that bridges this gap.
Forward testing involves executing your strategy rules in live market conditions using a demo account. This step allows you to verify:
- Execution Slippage: In a backtest, orders are assumed to fill at the exact chart price. In live trading, especially during news events, your orders may experience slippage, filling at a slightly worse price.
- Broker Spreads & Fees: Real-time variable spreads can expand during session crossovers or volatility, eating into your profit targets.
- Emotional Integrity: Executing trades as the price fluctuates in real-time tests your ability to follow the rules without hesitating or micro-managing positions.
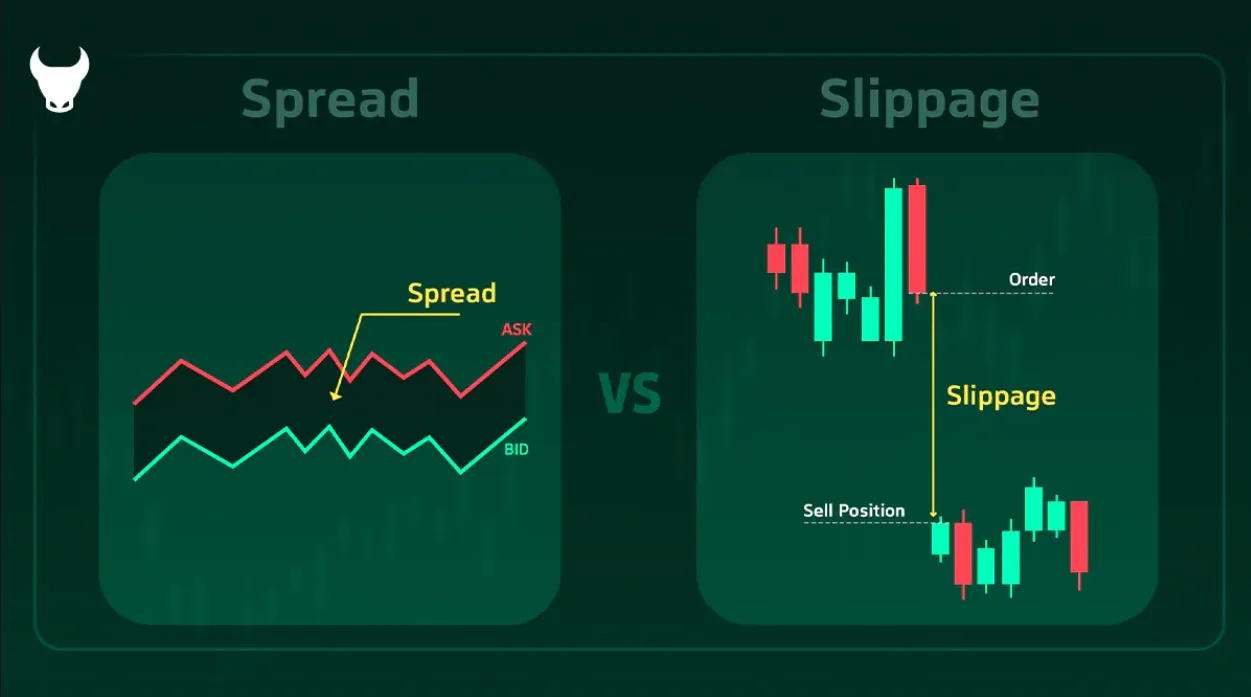 Live Execution Discrepancies (Slippage and Spread Expansion)
9. Market Regimes: Why Historical Context Matters
A common mistake is backtesting a strategy during a single trend cycle (e.g., a six-month period of strong upward movement in indices) and assuming it will always perform well.
Markets shift between four distinct regimes:
- Bullish Trend: Upward price movement with high volume.
- Bearish Trend: Downward price movement with expanding volatility.
- High-Volatility Range: Wide price swings without clear direction.
- Low-Volatility Consolidation: Tight, choppy price bands.
A trend-following system (like a moving average crossover) will perform exceptionally well in regimes 1 and 2, but will lose capital rapidly in regimes 3 and 4. Your backtest must cover a multi-year period that spans all four regimes to calculate a realistic drawdown and profitability profile.
Quantitative systems often employ market filters like the ADX (Average Directional Index) to measure trend intensity or the ATR (Average True Range) ratio to map volatility. When the ADX falls below 20, signifying a rangy market, the system automatically disables trend entry signals to protect equity capital.
10. Monte Carlo Simulations: Stress-Testing Sequence Risk
Even if your backtest shows a 60% win rate and a positive expectancy, the order in which those wins and losses occur is random. In a sample of 100 trades, it is mathematically possible to experience a sequence of 8, 10, or even 12 consecutive losses. This is known as sequence risk.
Monte Carlo simulation is a mathematical technique that takes your backtested trade results and scrambles them into thousands of random sequences.
- By simulating 10,000 different orders of those same trades, the model calculates the probability of account ruin (hitting your maximum risk limit) at various risk-per-trade sizes.
- If a Monte Carlo simulation reveals a 25% chance of account ruin when risking 3% per trade, you know you must lower your risk to 1% or 2% to ensure long-term survival.
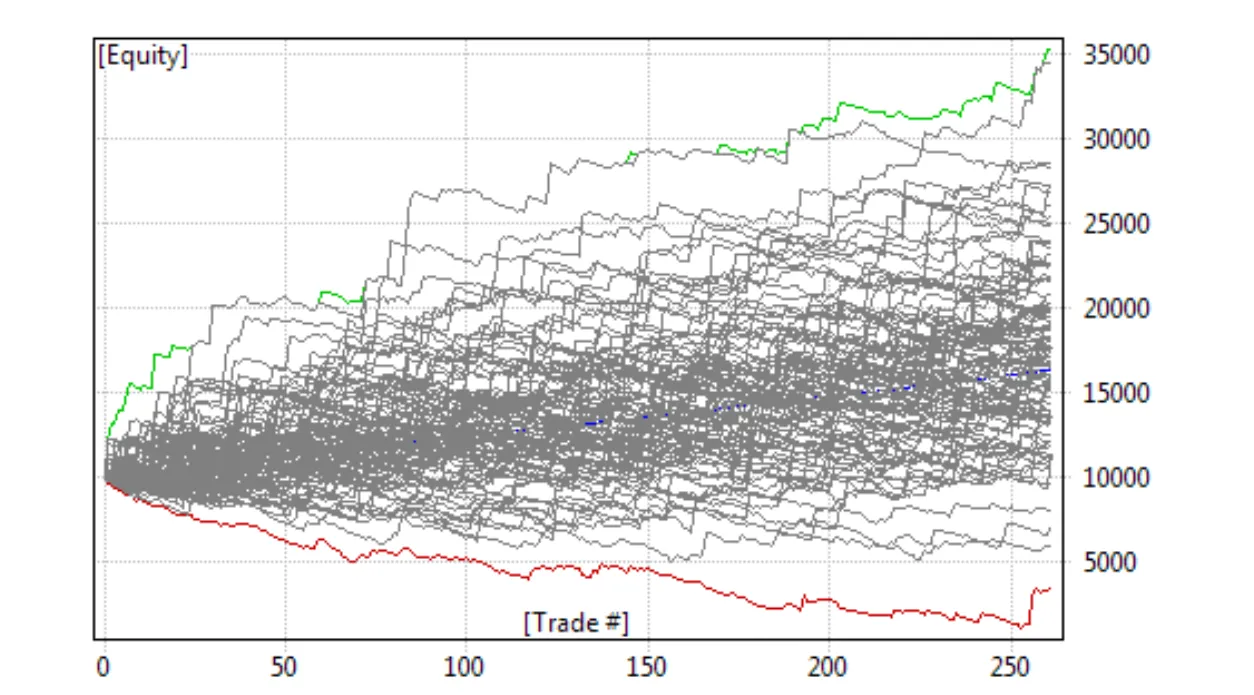 Monte Carlo Simulation of Sequence Ruin Risks
11. Case Study: Backtesting and Strategy Optimization with GainzAlgo
To see how modern technology simplifies this verification process, we can look at the capabilities of GainzAlgo.
Rather than requiring you to code complex scripts, GainzAlgo operates as a highly optimized, proprietary technical indicator designed specifically for the TradingView platform. It processes real-time volatility, volume, and trend-reversal data to overlay clear signals on your charts.
High-Speed Signal Verification
Because GainzAlgo uses strict, mathematical rules to generate its “BUY” and “SELL” signals, it eliminates the threat of hindsight bias.
- Non-Repainting Signals: Unlike low-quality indicators that alter past signals to look perfect in retrospect, GainzAlgo signals are fixed in real-time. In Pine Script development, this is controlled by ensuring the indicator logic calculates only when
barstate.isconfirmedis true, locking in the value as the candle closes. This allows you to use TradingView’s Bar Replay tool to step back in time and backtest the indicator’s performance candle-by-candle under real market conditions. - Integrated Risk Management: The indicator features built-in, dynamic Take Profit (TP) and Stop Loss (SL) zones that adapt to current market volatility (utilizing multi-period ATR values). This helps you instantly log risk-reward ratios and drawdowns during your backtests.
- Cross-Market Testing: You can test the indicator across Forex pairs, stock indices, cryptocurrencies, and gold, identifying which asset class and time frame matches your trading schedule.
By combining GainzAlgo’s rule-based outputs with a strict logging protocol, you can build a validated, statistically sound trading plan before opening a single live trade.
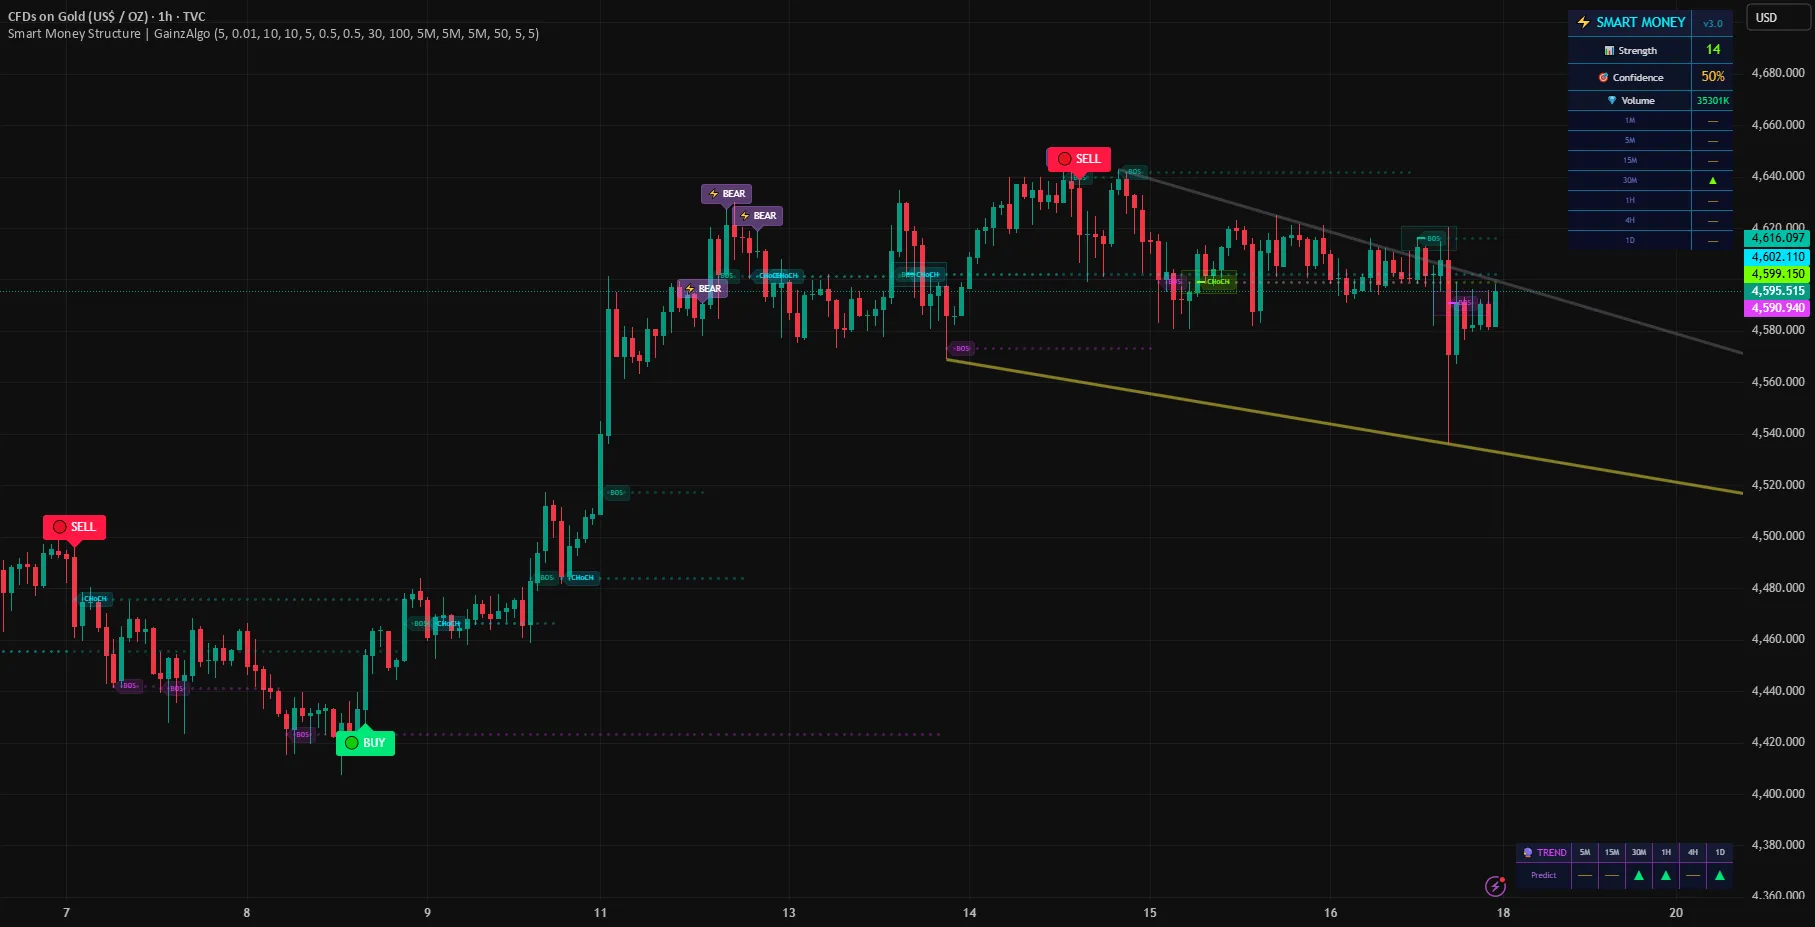 GainzAlgo Signals and Dynamic Risk Zones on TradingView
12. Next Steps: Building Your Testing Protocol
If you are ready to transition from discretionary guessing to systematic, data-backed trading, follow this step-by-step testing protocol:
- Define Your Asset and Timeframe: Start with a liquid asset (like EUR/USD or Gold) on a standard timeframe (like the 1-hour or 4-hour chart).
- Establish Strict Rules: Write down your entry triggers, stop-loss calculations (e.g., 2 ATR from entry), and exit parameters. Or, activate an algorithmic tool like GainzAlgo to provide these rules.
- Run the Backtest: Use a replay tool to log at least 100 historical trades in a spreadsheet, noting the entry price, exit price, drawdown, and net result of each trade.
- Analyze the Metrics: Calculate your Profit Factor, Expectancy, and Maximum Drawdown. If the expectancy is negative, refine the rules and repeat.
- Forward Test: Once you have a positive historical backtest, run the strategy on a demo account (paper trading) for at least one month to verify live execution.
By treating trading as a scientific process of testing and optimization, you build a resilient edge that can withstand any market environment.
Conclusion: Backtesting is the foundation of professional trading. Whether you manually track setups or deploy specialized indicators like GainzAlgo to automate signals, historical validation is an essential step to achieving long-term market profitability.